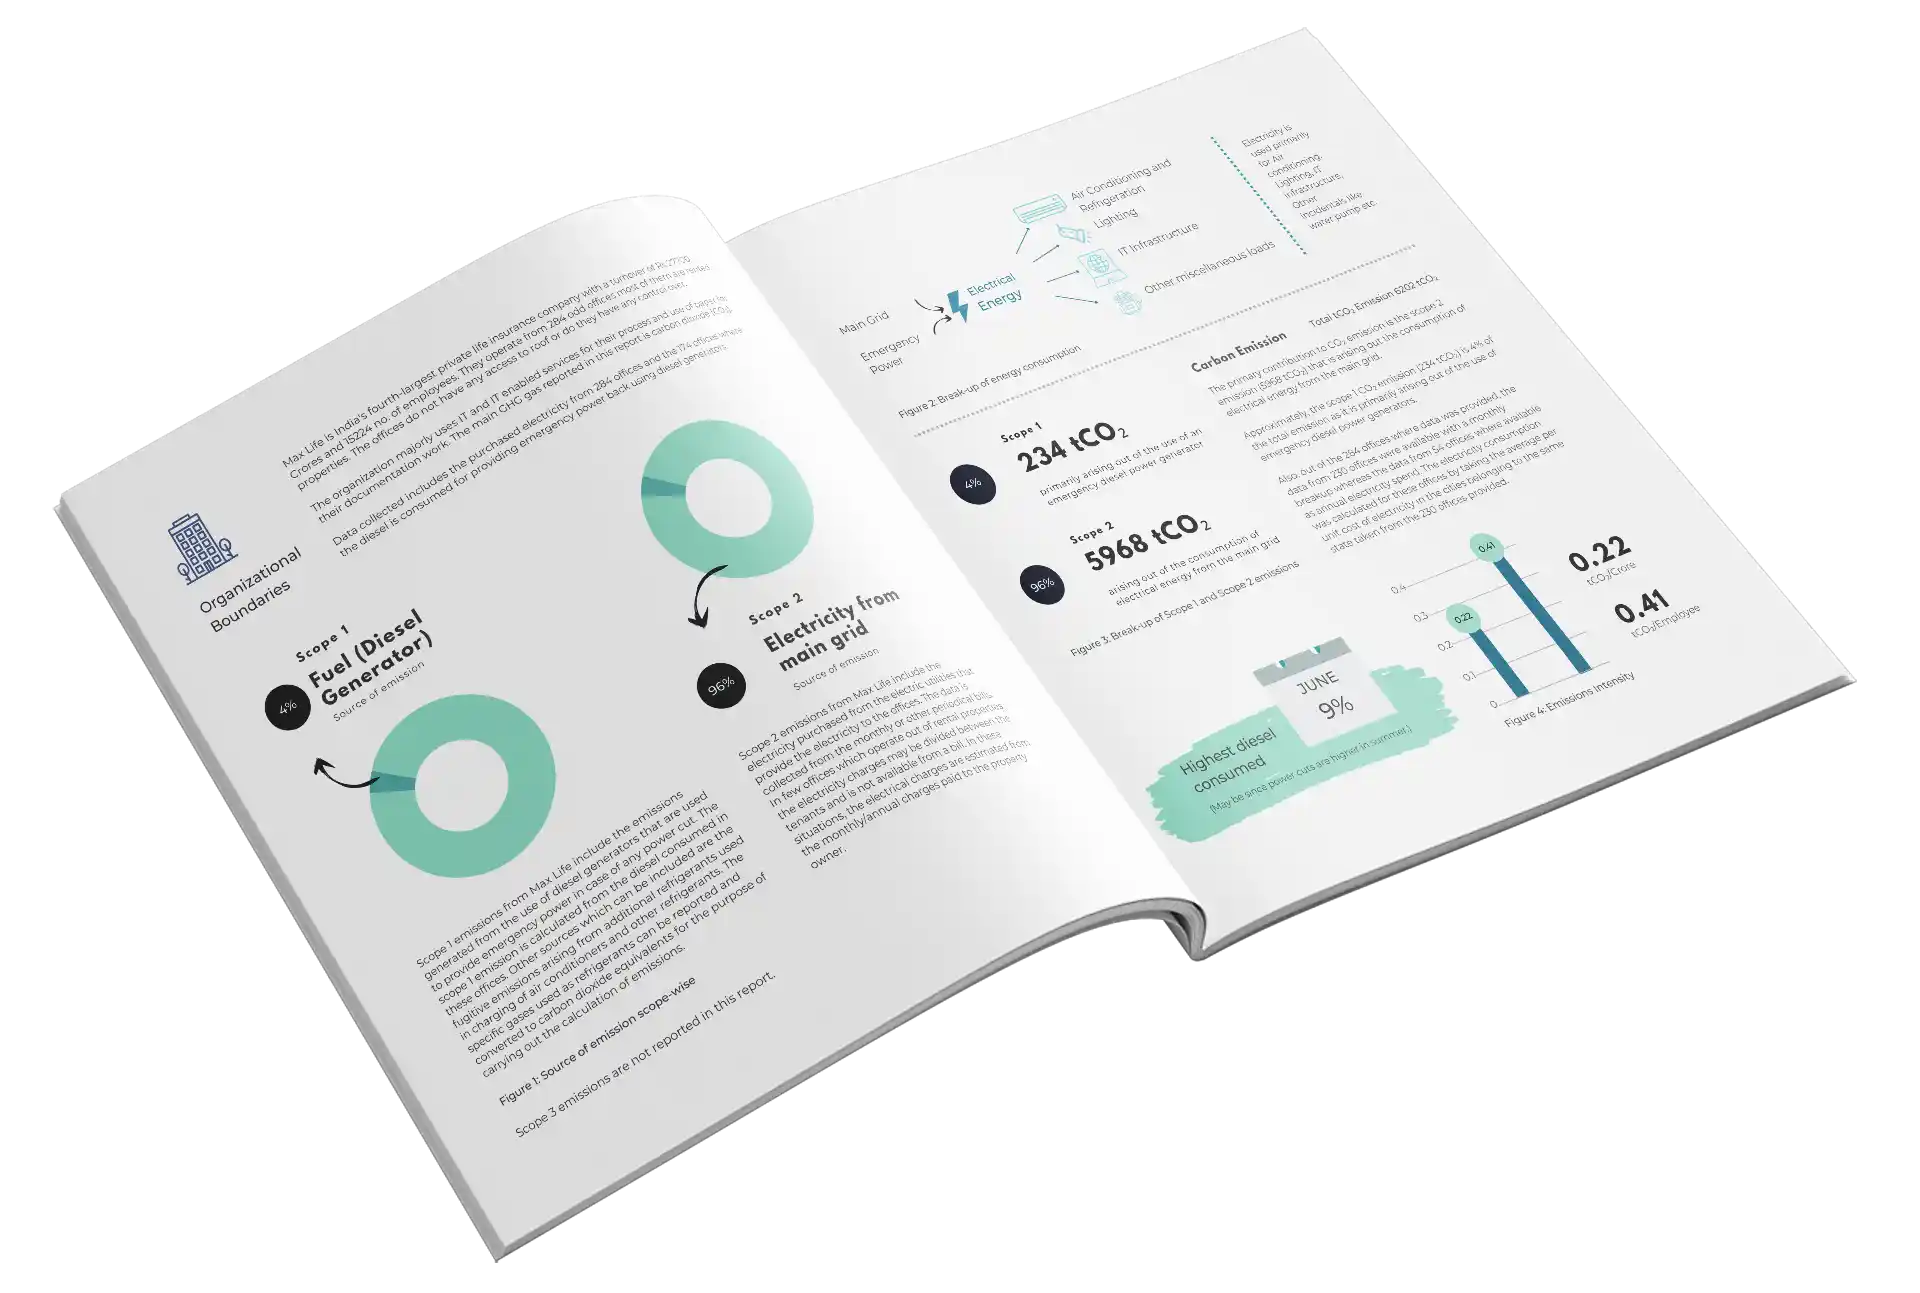
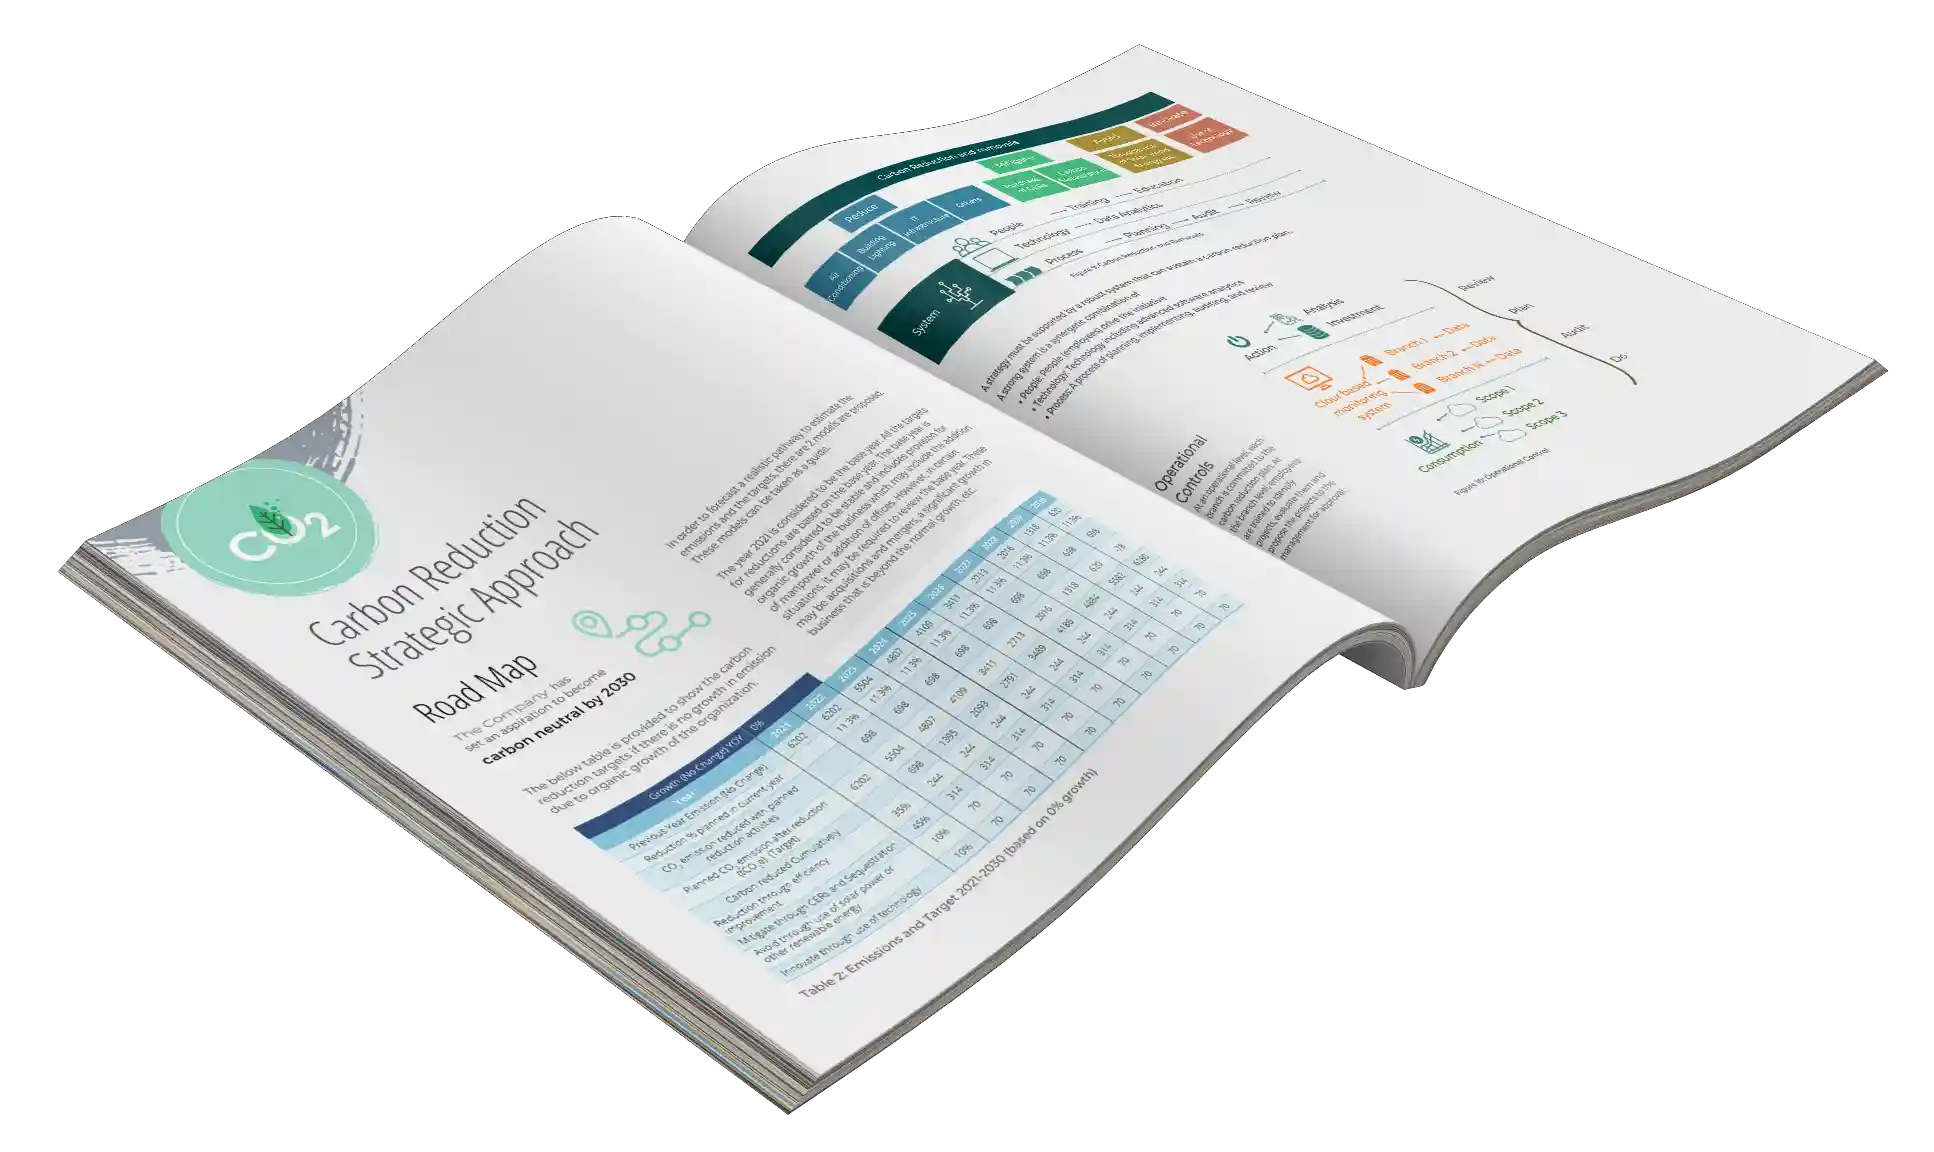
Data is presented through understated yet impactful visualizations, such as infographics, charts, and graphs, ensuring clarity without overwhelming the reader. These elements are strategically placed, making statistical insights accessible and actionable.