Navigating the vibrant realm of sustainability reporting is akin to painting on a canvas: colors evoke emotion, guide the eye, and tell a story. Here, we delve into the art of using colors effectively, ensuring that data shines through while resonating with the reader. From emphasizing crucial information to infusing brand essence, every hue has its role. Dive in, as we explore the palette of sustainable storytelling.
Highlight Key Information
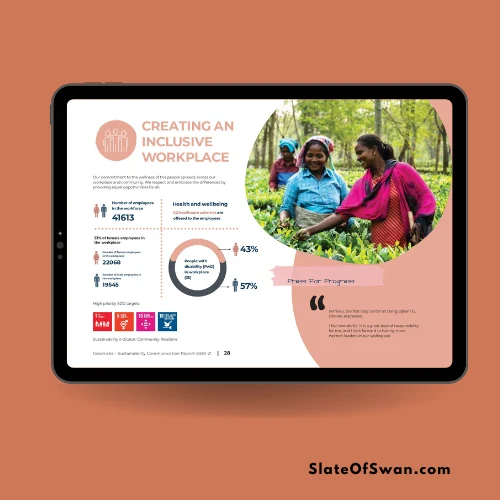
Use a bold or vibrant color to highlight important figures, trends, or findings. This directs the reader’s focus to critical data points.
Color Coding
If your report covers different aspects like environmental, social, and governance topics, consider using a color code for each section. This helps readers quickly identify and navigate through different themes.
Environmental Associations
Select colors that align with the topics you’re discussing. For instance, shades of blue and green can reflect environmental themes, while earthy tones may represent sustainability.
Consistency and Contrast
Maintain a consistent color palette throughout the report for a polished look. Ensure there’s enough contrast between text and background colors to ensure readability.
Cultural Sensitivity
Be aware of cultural associations with colors. Different colors can hold varying meanings in different cultures, so choose hues that are culturally sensitive.
Negative Space
Use white or neutral backgrounds to ensure that the colors used stand out and don’t overwhelm the reader.
Subtle and Tasteful
While vibrant colors can grab attention, use them judiciously. Too many bright colors can be distracting and reduce readability.
Branding Accents
Use colors to accentuate your brand’s values and messages. This reinforces your brand’s commitment to sustainability.
Typography Contrast
Colors can also work in tandem with typography. Use color to differentiate headings, subheadings, and body text for better readability.
Thematic Cohesion
If you’re addressing various sustainability goals, assign specific colors to each goal. This helps readers quickly identify the topic being discussed.
Remember, the goal is to create a visually appealing report that aids comprehension and engagement without overwhelming the reader. Properly leveraging colors can help you achieve this by making your sustainability report both impactful and aesthetically pleasing
The use of colors in designing a sustainability report is a critical aspect of conveying information, engaging stakeholders, and promoting a company’s commitment to environmental and social responsibility. Colors can be powerful tools for communication and can enhance the overall impact of the report.
Here are some key considerations for using colors effectively in a sustainability report:
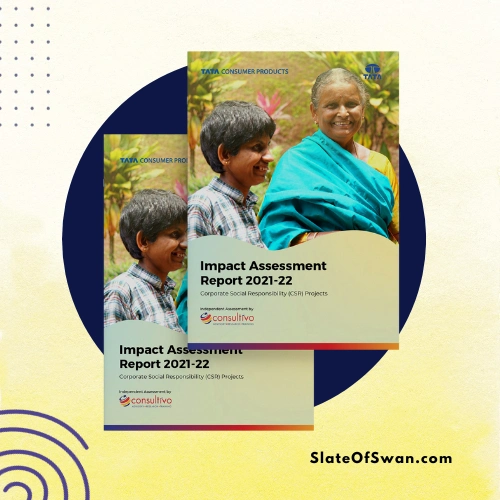
Brand Consistency: Start by considering your company’s brand colors. Incorporate these colors into the report’s design to maintain brand consistency. This helps readers immediately identify the report as belonging to your organization.
Color Psychology: Utilize the psychological impact of colors to evoke specific emotions and responses. For example:
- Green: Represents sustainability, growth, and environmental consciousness.
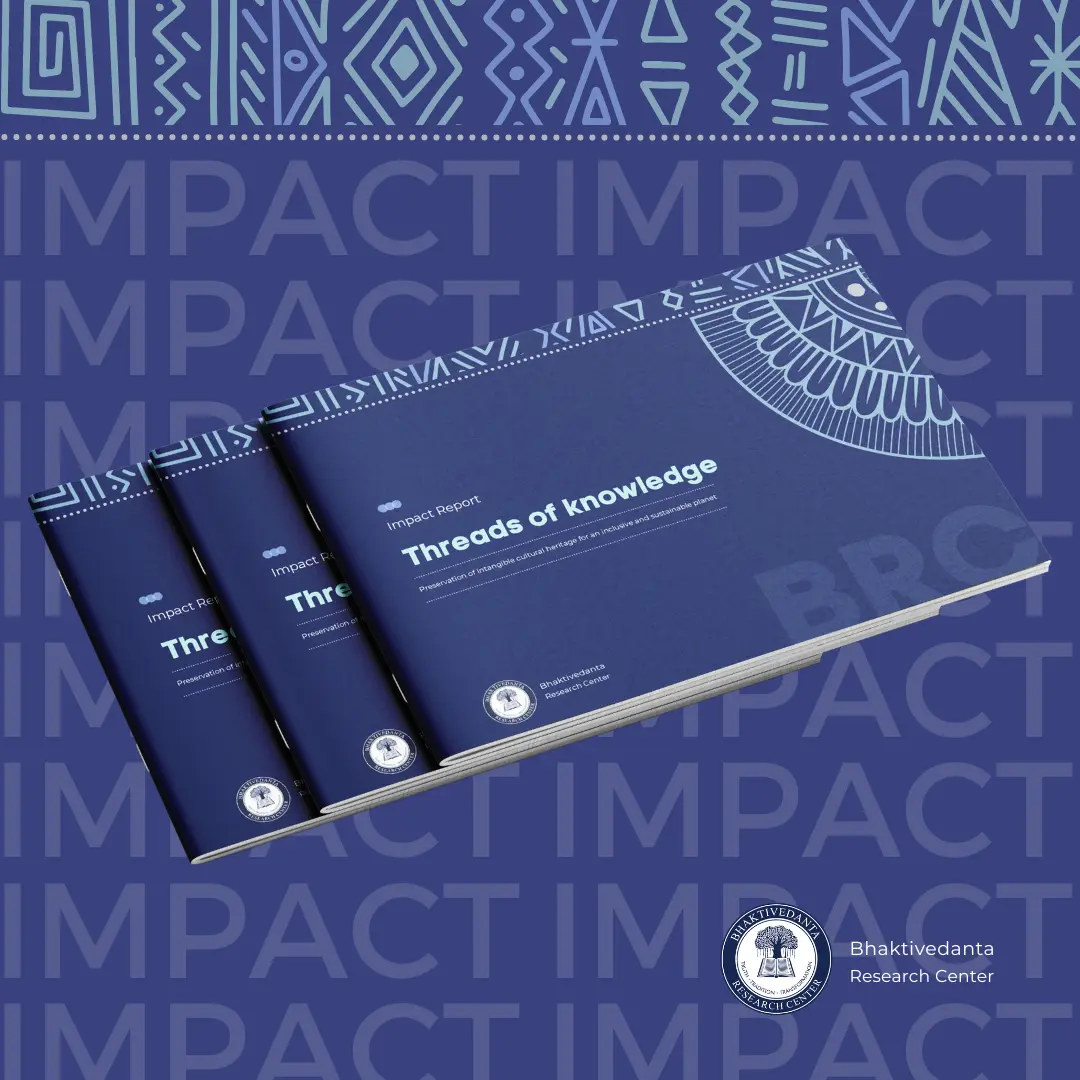
- Blue: Conveys trust, stability, and a commitment to transparency.
- Earth Tones: Reflect a connection to nature and the environment.
- Warm Colors: Can evoke a sense of urgency or passion when used strategically.
Data Visualization: Use color to highlight key data points, trends, or achievements. For instance, you can use a specific color to represent positive progress and another for areas that need improvement. Color-coded charts and graphs make complex information more accessible.
Hierarchy and Organization: Employ a consistent color scheme to create a visual hierarchy within the report. For example, use a dominant color for headings and subheadings, a secondary color for charts and visuals, and a neutral color for background elements. This helps readers navigate the report and find relevant information easily.
Icons and Symbols: Incorporate color into icons and symbols to represent various sustainability goals or achievements. For instance, a green leaf can symbolize eco-friendly practices, while a blue drop of water may signify water conservation efforts.
Accessibility: Ensure that your choice of colors considers accessibility guidelines. High contrast between text and background colors is essential to make the report readable for all audiences, including those with visual impairments.
Cultural Sensitivity: Be aware of cultural associations with colors. Some colors may have different meanings in various cultures, so ensure that your color choices are culturally sensitive, especially if your company operates in a global context.
Print vs. Digital: Consider the medium in which the report will be primarily consumed. Colors may appear differently in print compared to digital formats, so test the color palette in both contexts to ensure consistency and legibility.
Consistency Over Time: If you release sustainability reports regularly, maintain consistency in your color choices and design elements. This helps build recognition and trust among stakeholders.
However, it is important to use color judiciously and not overuse it. Overuse of color can make the report look cluttered and difficult to read. It is also important to ensure that the colors used are accessible to all readers, including those with color vision deficiencies
Visual Storytelling: Use colors to tell a visual story that supports the narrative of your sustainability efforts. For instance, you can use a timeline with changing colors to depict progress over the years.
Colors play a crucial role in designing a sustainability report that effectively communicates your company’s commitment to responsible business practices. Thoughtful and strategic use of colors can enhance the report’s visual appeal, readability, and ability to engage stakeholders in your sustainability journey.
The use of color can play a significant role in designing sustainability and ESG reports. Color can be used to convey information, create visual interest, and enhance the overall readability of the report. For example, using green to represent environmental metrics, blue for social metrics, and purple for governance metrics can help readers quickly identify the different sections of the report 1.
Moreover, color can be used to highlight key data points and trends in the report. For instance, using a bright color like red to highlight a negative trend or a positive trend with green can help readers quickly identify areas that require attention or areas where the company is doing well 1.
Colors can be used to:
Convey the company’s commitment to sustainability. Certain colors are often associated with sustainability, such as green, blue, and white. Using these colors in a sustainability report can help to communicate the company’s commitment to environmental protection and social responsibility.
Make the report more visually appealing and engaging. Well-chosen colors can make a sustainability report more visually appealing and engaging, which can help to keep readers’ attention and encourage them to read the entire report.
Highlight key information. Colors can be used to highlight key information in a sustainability report, such as the company’s environmental goals, its progress towards achieving those goals, and the benefits of its sustainability initiatives.
Differentiate between different sections of the report. Colors can be used to differentiate between different sections of a sustainability report or a CSR report, such as the executive summary, the body of the report, and the appendix. This can help readers to quickly and easily find the information they are looking for.
When choosing colors for a sustainability report, it is important to further consider the following factors:
The company’s branding. The colors used in the report should be consistent with the company’s branding. This will help to create a cohesive and professional look for the report.
The target audience. The colors used in the report should be appropriate for the target audience. For example, a report aimed at investors may use different colors than a report aimed at employees.
The message that the company wants to convey. The colors used in the report should be used to convey the company’s message about sustainability. For example, a company that is committed to reducing its environmental impact may use green as a primary color.
Here are some specific examples of how colors can be used in sustainability and ESG reports:
Green: Green is often associated with nature and environmental protection, so it is a common color used in sustainability reports. For example, the 2022 Sustainability Report of Microsoft uses green throughout the report to highlight its commitment to sustainability.
Blue: Blue is often associated with water and cleanliness, so it can also be used in sustainability reports to convey a message of environmental protection. For example, the 2023 ESG Report of Unilever uses blue to highlight its water conservation initiatives.
White: White is often associated with purity and simplicity, so it can be used in sustainability reports to create a clean and uncluttered look. For example, the 2022 Sustainability Report of Nike uses white as a background color to make the text and graphics stand out.
Neutral colors: Neutral colors, such as beige, brown, and gray, can also be used in sustainability reports. These colors can be used to create a sense of calm and stability, which can be helpful for conveying complex information. For example, the 2022 Sustainability Report of Coca-Cola uses a neutral color palette to make the report easy to read and understand.