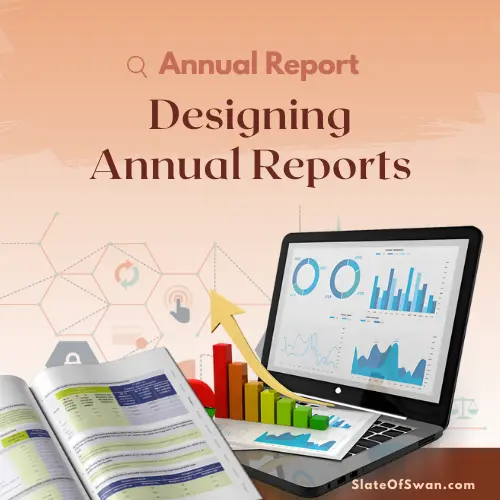
Understanding the importance of report UI design
The significance of effective Report UI Design cannot be overstated. In the realm of Corporate Reporting, where stakeholders ranging from executives to investors rely on clear and concise information, a well-designed report can build trust and transparency. It allows users to quickly grasp key findings, identify trends, and understand the underlying story within the data. Poor report design, on the other hand, can obscure crucial information, leading to misinterpretations and flawed decision-making.
Consider the impact of a visually appealing and intuitively structured Corporate Report. When information is presented logically, with clear headings, consistent formatting, and well-chosen visualizations, users can navigate the document effortlessly. This not only saves time but also enhances comprehension. Conversely, a cluttered layout, inconsistent styling, or confusing charts can overwhelm the reader, making it difficult to extract the necessary insights.
Report UI design considerations for ESG and sustainability reports
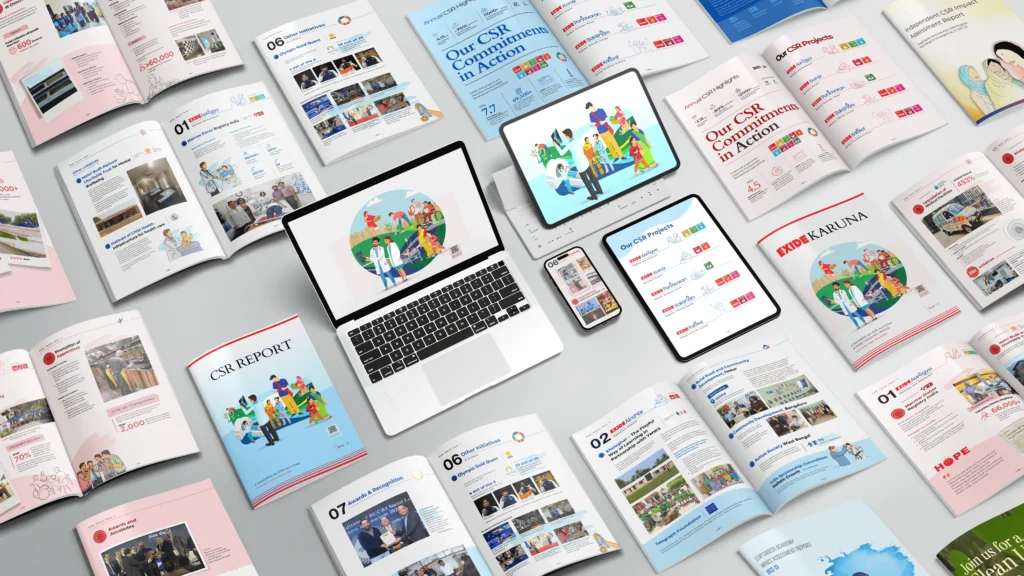
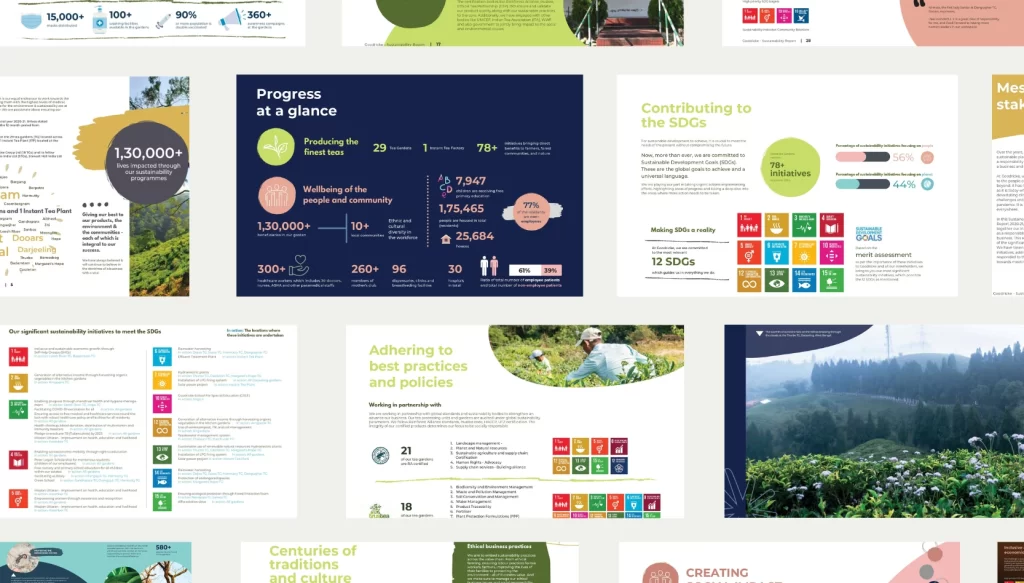
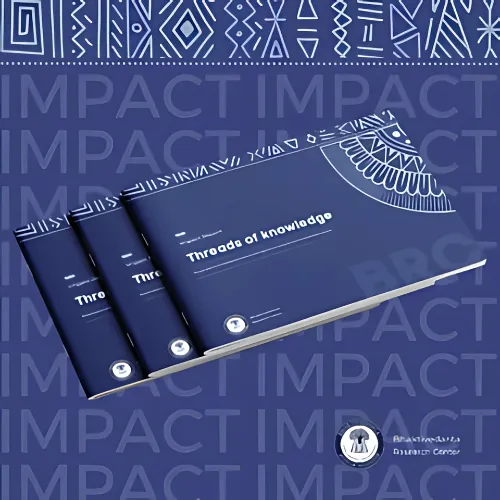
Furthermore, in today’s environmentally and socially conscious landscape, ESG Report Design Services, Sustainability report design and CSR Report Design are increasingly important. These reports communicate an organization’s commitment to environmental, social, and governance (ESG) factors. A compelling UI design can effectively convey the impact of sustainability initiatives, engaging stakeholders and reinforcing the company’s values. A visually appealing and well-organized Corporate Report on sustainability can significantly enhance its impact and credibility.
Investing in a professional Corporate Design Service that prioritizes user-centric Corporate Report design is a strategic move. It ensures that your reports are not just repositories of data, but powerful communication tools that drive understanding and action.
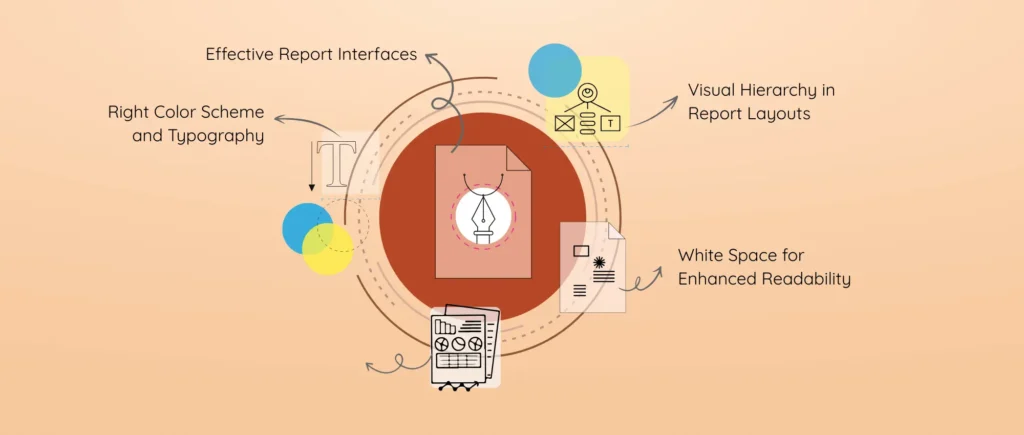
Key principles of user-centered design
A well-designed report interface comprises several key elements that work together to create a seamless and intuitive user experience. These include:
Understanding the audience
Identify the different stakeholders who will be interacting with the report. Consider their level of data literacy, their specific areas of interest, and their preferred methods of information consumption.
Defining user goals
Determine what users need to achieve by reading the report. Are they looking for a high-level overview, detailed analysis, or specific data points? Understanding these goals will inform the structure and content prioritization within the corporate report.
Considering the context
Think about where and how the report will be accessed. Will it be primarily viewed on desktop computers, tablets, or mobile devices? Will it be printed or distributed digitally? This will influence decisions about layout, responsiveness, and interactive elements.
Iterative design and feedback
The design process should be iterative, involving user feedback at various stages. Creating prototypes and gathering input allows for continuous refinement and ensures that the final report design truly meets user needs.
By adhering to these user-centered principles, you can create report designs that are not only visually appealing but also highly functional and effective in communicating critical information.
Essential Elements of Effective Report Interfaces
A well-designed report interface comprises several key elements that work together to create a seamless and intuitive user experience. These include:
Clear Navigation
Users should be able to easily navigate through the report and find the information they need quickly. This can be achieved through a well-defined table of contents, clear section headings, and logical flow of information. In digital reports, interactive navigation menus and internal links can further enhance usability.
Consistent Layout and Formatting
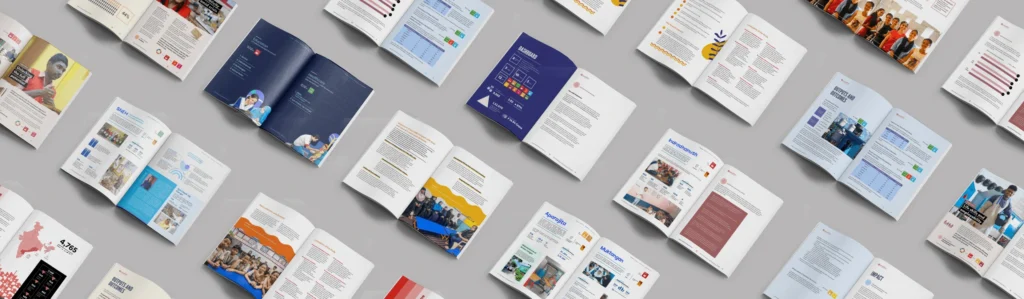
Maintaining consistency in layout, typography, and visual elements throughout the report creates a sense of coherence and professionalism. This helps users to quickly recognize patterns and understand the structure of the information.
Effective Use of Visuals
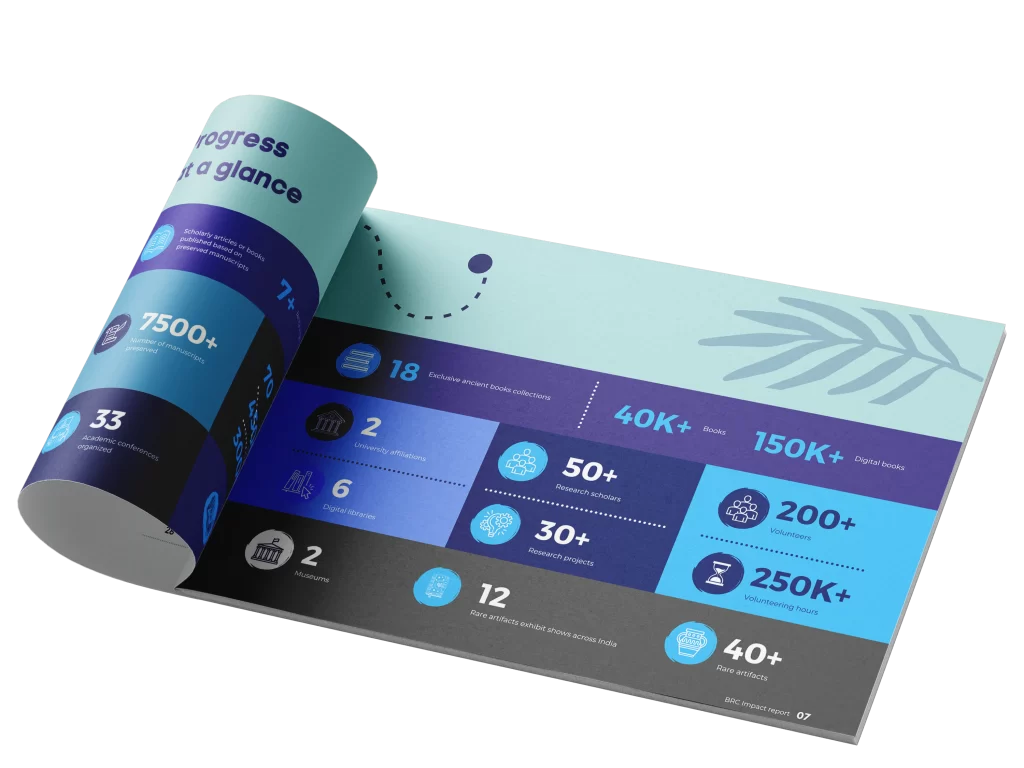
Charts, graphs, and other visual elements play a crucial role in presenting data in an accessible and engaging way. Choosing the right type of visualization for the data and ensuring clarity and accuracy are essential aspects of good report design.
Concise and Clear Language
The language used in the report should be clear, concise, and free of jargon. Technical terms should be explained, and the overall tone should be professional and easy to understand.
Accessibility
Reports should be designed with accessibility in mind, ensuring that they can be used by individuals with disabilities. This includes providing alternative text for images, using sufficient color contrast, and ensuring keyboard navigation for digital reports.
By carefully considering and implementing these essential elements, you can create report designs that are both informative and user-friendly, enhancing the overall effectiveness of your Corporate Reporting.
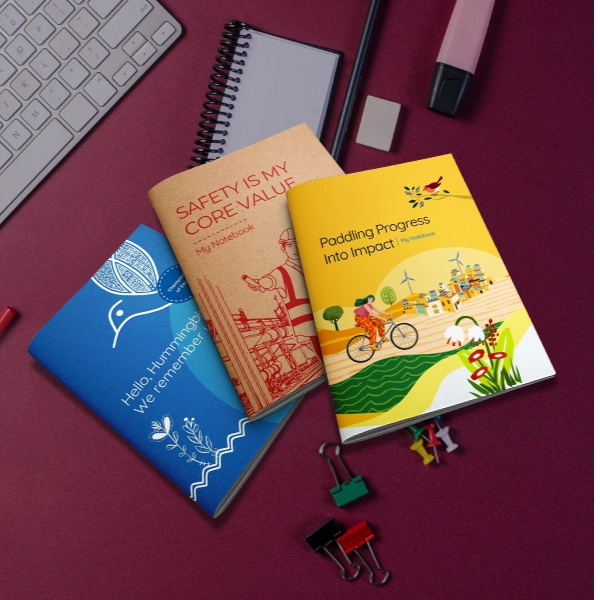
Choosing the Right Color Scheme and Typography
The visual aesthetics of a report significantly impact its readability and overall perception. Selecting an appropriate color scheme and typography is crucial for creating a professional and engaging report design.
Color Scheme
1.
Brand Alignment
The color scheme should ideally align with your organization’s branding guidelines, reinforcing brand recognition and consistency across all Corporate Report materials.
2. Readability and Contrast
Choose colors that provide sufficient contrast between text and background to ensure readability. Avoid using overly bright or distracting colors that can strain the eyes.
3. Data Visualization
When using color in charts and graphs, select a palette that is clear, intuitive, and appropriate for the type of data being presented. Consider using color to highlight key trends or comparisons.
4. Emotional Impact
Different colors can evoke different emotions. Consider the overall message of the report and choose colors that align with the desired tone. For instance, blues and greens often convey trust and stability, which can be suitable for Corporate Reporting.
Typography
1. Legibility
Prioritize legibility when selecting fonts for body text. Choose clean and readable sans-serif or serif fonts.
2. Hierarchy
Use different font sizes, weights, and styles to establish a clear visual hierarchy within the text. Headings should be distinct from subheadings and body text.
3. Consistency
Maintain consistency in font choices throughout the report. Limiting the number of different fonts used (ideally to two or three) will create a more cohesive and professional look.
4. Accessibility
Ensure that the chosen fonts are accessible and render well across different devices and screen resolutions.
Careful consideration of color and typography can significantly enhance the visual appeal and readability of your report designs, contributing to a more positive user experience in Corporate Reporting.
Utilizing White Space for Enhanced Readability
White space, also known as negative space, is the empty area around text and visual elements in a report design. Far from being wasted space, it plays a crucial role in enhancing readability, reducing clutter, and improving the overall visual appeal of the report.
Effective use of white space can:
Improve Readability
By providing visual breathing room around text, white space makes it easier for users to scan and comprehend information. It prevents text blocks from appearing dense and overwhelming.
Create Visual Hierarchy
Strategic use of white space can help to separate different sections of the report and draw attention to key elements. It guides the reader’s eye and helps them to understand the structure of the information.
Improve Aesthetics
Generous use of white space can create a clean, modern, and professional look for your report designs. It conveys a sense of clarity and sophistication.
Enhance Focus
White space can isolate visual elements, such as charts and graphs, making them stand out and allowing users to focus on the data being presented.
When designing your reports, consciously consider the use of white space. Avoid overcrowding the page with too much text or too many visuals. Allow for ample negative space around headings, paragraphs, images, and charts. This simple yet powerful technique can significantly improve the user experience of your Corporate Report.
Incorporating Visual Hierarchy in Report Layouts
Visual hierarchy refers to the arrangement of elements in a report design to guide the reader’s eye and indicate the relative importance of different pieces of information. A well-defined visual hierarchy ensures that users can quickly identify key takeaways and navigate the report effectively.
Key techniques for establishing visual hierarchy include:
Size and Weight
Larger and bolder elements naturally attract more attention. Use larger font sizes for headings and emphasize key data points with bold text.
Placement
Place the most important information in prominent positions, such as at the top of a page or section. The F-pattern and Z-pattern are common reading patterns to consider when structuring your layout.
Color and Contrast
Use color and contrast strategically to highlight important elements and create visual distinctions.
Spacing
Use white space to separate different sections and create visual breaks, guiding the reader through the content in a logical flow.
Alignment
Consistent alignment of text and visual elements creates a sense of order and structure, making the report easier to read and understand.
By thoughtfully applying these techniques, you can create report designs with a clear visual hierarchy, enabling users to quickly grasp the most critical information and navigate the report efficiently. This is particularly important in complex Corporate Reporting scenarios where large volumes of data need to be presented clearly.
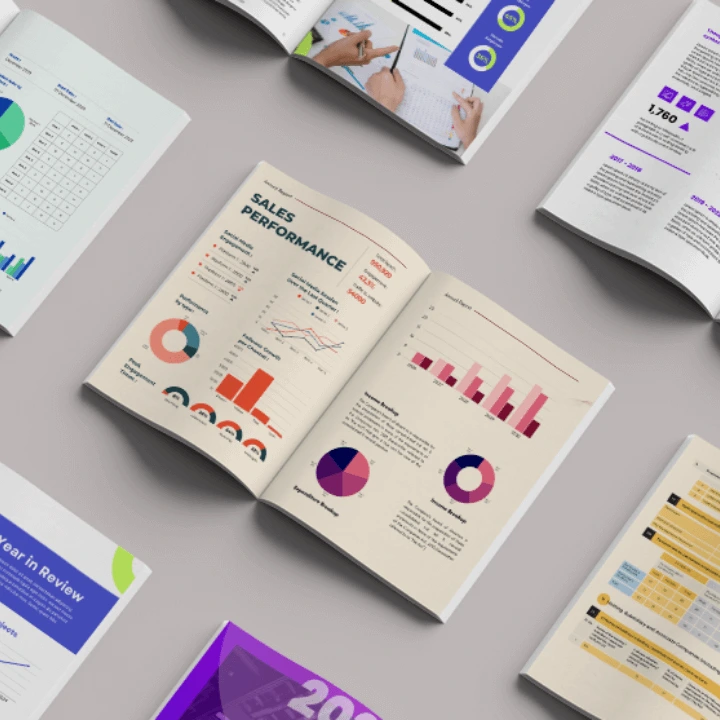
Best Practices for Data Visualization in Reports
Data visualization is a cornerstone of effective Report UI Design. Charts, graphs, and other visual representations can transform raw data into easily understandable insights. However, poorly executed visualizations can be misleading or confusing. Adhering to best practices is crucial for creating impactful and accurate data visualizations in your reports.
Key best practices include:
Choosing the Right Chart Type
Select the chart type that is most appropriate for the type of data you are presenting and the message you want to convey. Bar charts are excellent for comparisons, line charts for trends over time, and pie charts for proportions of a whole (though use them sparingly and ensure clear labeling).
Keeping it Simple
Avoid cluttering your visualizations with unnecessary elements. Remove extraneous gridlines, labels, and decorations that do not add value to the understanding of the data.
Clear and Concise Labels
Ensure that all axes, data points, and legends are clearly and concisely labeled. Use descriptive titles that accurately reflect the data being presented.
Consistent Styling
Maintain a consistent visual style for all charts and graphs throughout the report. This includes using the same color palette, font styles, and label formatting.
Accurate Representation
Ensure that your visualizations accurately represent the underlying data. Avoid distorting scales or using misleading visual cues.
Contextual Information
Provide sufficient context to help users interpret the visualizations correctly. This may include adding brief explanations or annotations.
Interactive Elements (for Digital Reports)
In digital Corporate Report formats, consider incorporating interactive elements such as tooltips, drill-down capabilities, and filtering options to allow users to explore the data in more detail.
By following these best practices, you can create compelling and informative data visualizations that enhance the user experience and facilitate a deeper understanding of the information presented in your report designs. This is particularly vital in areas like Sustainability report design and CSR Report Design, where visual data can powerfully communicate impact.
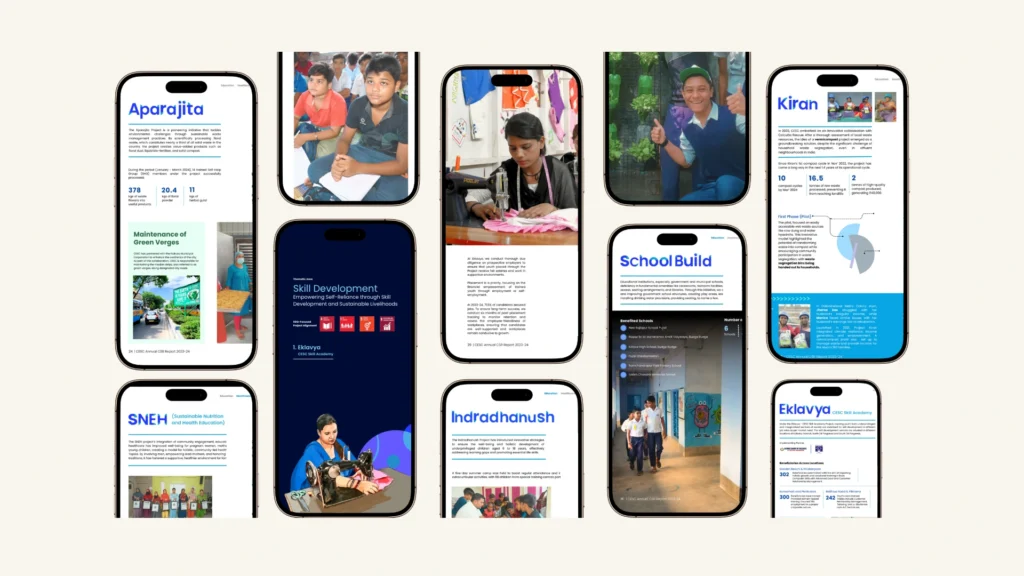
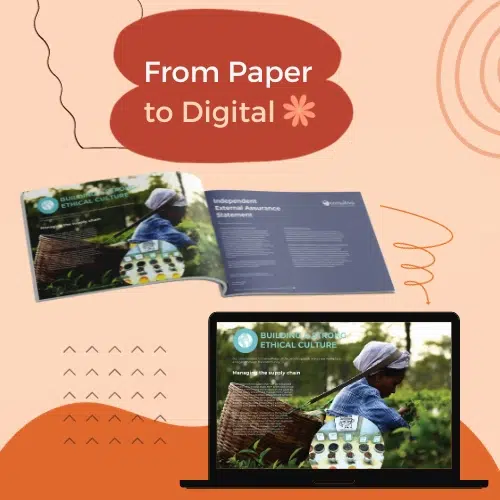
Mobile Responsiveness in Report UI Design
In today’s multi-device world, ensuring mobile responsiveness is increasingly important for Report UI Design. Users may need to access reports on their smartphones or tablets, and a report that is not optimized for smaller screens can lead to a frustrating and unusable experience.
Key considerations for mobile responsiveness include:
Flexible Layouts
Design layouts that can adapt to different screen sizes and orientations. Consider using responsive design frameworks or grid systems.
Scalable Typography and Images
Use scalable fonts and images that adjust appropriately to smaller screens without becoming illegible or distorted.
Touch-Friendly Navigation
Ensure that interactive elements, such as buttons and links, are large enough and spaced adequately for easy tapping on touchscreens.
Prioritization of Content
On smaller screens, prioritize the most important information and consider collapsing less critical content into expandable sections.
Testing on Multiple Devices
Thoroughly test your report designs on a range of mobile devices and screen sizes to ensure optimal viewing and functionality.
While traditionally, Corporate Reporting might have focused on printed or desktop-based reports, the increasing demand for on-the-go access necessitates a shift towards mobile-responsive report designs. This ensures that users can access critical information anytime, anywhere, enhancing the overall usability and impact of your reports.
Common Mistakes to Avoid in Report UI Design
Even with a strong understanding of best practices, it’s easy to fall into common pitfalls in Report UI Design. Being aware of these mistakes can help you avoid them and create more effective reports.
Common mistakes to avoid include:
Cluttered Layouts
Overcrowding the page with too much information or too many visual elements can overwhelm users and make it difficult to focus on key takeaways.
Inconsistent Styling
Lack of consistency in typography, color schemes, and formatting can create a disjointed and unprofessional look.
Poor Data Visualization Choices
Selecting inappropriate chart types or creating misleading visualizations can distort the data and lead to incorrect interpretations.
Ignoring White Space
Failing to utilize white space effectively can result in dense and difficult-to-read reports.
Lack of Clear Navigation
If users cannot easily navigate through the report and find the information they need, they will likely become frustrated.
Insufficient Contrast
Low contrast between text and background can make the report difficult to read, especially for users with visual impairments.
Overuse of Jargon
Using technical terms or acronyms without explanation can alienate users who are not familiar with the subject matter.
Ignoring Accessibility
Failing to design reports with accessibility in mind can exclude a significant portion of your audience.
By being mindful of these common mistakes and actively working to avoid them, you can significantly improve the quality and effectiveness of your report designs and enhance the user experience in Corporate Reporting.
Creating Impactful ESG Reports The Art of Design and Storytelling
Conclusion: Elevating User Experience in Report Design
In conclusion, mastering Report UI Design is essential for creating engaging, user-friendly, and ultimately effective reports. By understanding the importance of user-centered design, implementing key UI elements, and adhering to best practices for visual communication, you can transform your Corporate Reporting from a mere presentation of data into a powerful tool for insight and action.
Paying close attention to aspects like color scheme, typography, white space, visual hierarchy, and data visualization, while also considering mobile responsiveness and avoiding common design pitfalls, will elevate the user experience and ensure that your reports are not only informative but also a pleasure to interact with. Whether you are focusing on general report design, specific report designs, or specialized areas like Sustainability report design and CSR Report Design, a commitment to user-centric Corporate Report design, potentially leveraging professional Corporate Design Service, will undoubtedly lead to more impactful and successful communication of critical information. By prioritizing the user, you empower them to understand, analyze, and act on the data presented, ultimately maximizing the value of your reporting efforts.
- Know Your Audience: Tailor your report design to the specific needs and understanding of your users.
- Prioritize Clarity: Ensure your report is easy to read and understand at a glance.
- Visualize Data Effectively: Choose the right charts to tell the story of your numbers clearly.
- Maintain Consistency: Use uniform styling throughout for a professional and intuitive experience.
- Embrace White Space: Give your content room to breathe for better readability.
- Guide the Eye: Use visual hierarchy to highlight key information.
- Keep it Simple: Avoid clutter and focus on essential data and visuals.
- Test on Different Devices: Ensure your report looks and works well on all screen sizes.
- Focus on Navigation: Make it easy for users to find what they need quickly.
- Prioritize Accessibility: Design reports that are usable by everyone.